Determine whether the graph could represent a variable with a normal distribution. Explain your reasoning. 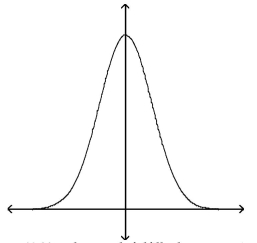
A) Yes, the graph fulfills the properties of the normal distribution
B) No, the graph is skewed left.
C) No, the graph crosses the x-axis.
D) No, the graph is not symmetric.
Correct Answer:
Verified
Q7: Find the area under the standard normal
Q8: Find the area under the standard normal
Q9: Find the area under the standard normal
Q10: Find the area of the indicated region
Q11: Determine whether the graph could represent a
Q13: Find the area under the standard normal
Q14: Find the sum of the areas under
Q15: The ACT is an exam used by
Q16: Find the area under the standard normal
Q17: Determine whether the graph could represent a
Unlock this Answer For Free Now!
View this answer and more for free by performing one of the following actions

Scan the QR code to install the App and get 2 free unlocks

Unlock quizzes for free by uploading documents