Determine whether the graph could represent a variable with a normal distribution. Explain your reasoning. 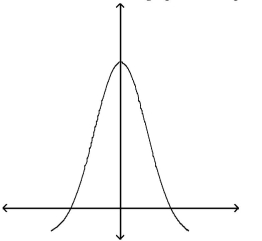
A) No, the graph crosses the x-axis.
B) No, the graph is skewed right.
C) No, the graph is not symmetric.
D) Yes, the graph fulfills the properties of the normal distribution.
Correct Answer:
Verified
Q6: Find the area under the standard normal
Q7: Find the area under the standard normal
Q8: Find the area under the standard normal
Q9: Find the area under the standard normal
Q10: Find the area of the indicated region
Q12: Determine whether the graph could represent a
Q13: Find the area under the standard normal
Q14: Find the sum of the areas under
Q15: The ACT is an exam used by
Q16: Find the area under the standard normal
Unlock this Answer For Free Now!
View this answer and more for free by performing one of the following actions

Scan the QR code to install the App and get 2 free unlocks

Unlock quizzes for free by uploading documents