The graph depicts IQ scores of adults, and those scores are normally distributed with a mean of 100 and a standard deviation of 15. Find the probability that a member selected at random is from the shaded area of the
Graph. 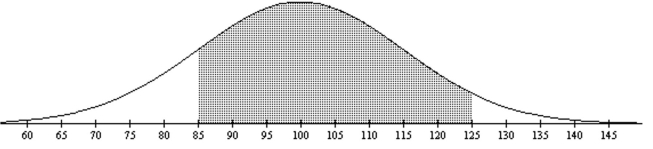
A) 0.7938
B) 0.7745
C) 0.7303
D) 0.7619
Correct Answer:
Verified
Q43: Assume that the heights of women are
Q44: The distribution of cholesterol levels in
Q45: Assume that the salaries of elementary school
Q46: Assume that the salaries of elementary school
Q47: An airline knows from experience that
Q49: The lengths of pregnancies of humans are
Q50: Assume that the heights of women are
Q51: IQ test scores are normally distributed with
Q52: An airline knows from experience that
Q53: The lengths of pregnancies of humans are
Unlock this Answer For Free Now!
View this answer and more for free by performing one of the following actions

Scan the QR code to install the App and get 2 free unlocks

Unlock quizzes for free by uploading documents