Use the grouped data formulas to find the indicated mean or standard deviation.
-A random sample of 30 high school students is selected. Each student is asked how many hours he or she spent on the Internet during the previous week. The results are shown in the histogram. Estimate the sample
Mean. 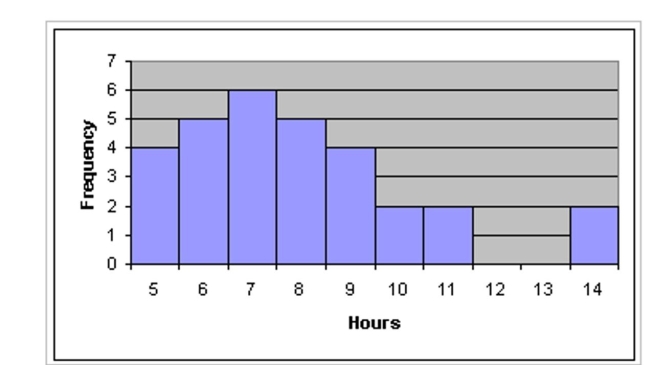
A) 7.9 hr
B) 7.7 hr
C) 8.1 hr
D) 8.3 hr
Correct Answer:
Verified
Q134: Use the grouped data formulas to
Q135: Use the grouped data formulas to
Q136: Provide an appropriate response.
-The weights (in
Q137: Use the grouped data formulas to
Q138: Use the grouped data formulas to
Q140: Provide an appropriate response.
-The cholesterol levels
Q141: Provide an appropriate response.
-The graph below is
Q142: Provide an appropriate response.
-The midpoints A,
Q143: Provide an appropriate response.
-The cholesterol levels
Q144: Provide an appropriate response.
-Use the data
Unlock this Answer For Free Now!
View this answer and more for free by performing one of the following actions

Scan the QR code to install the App and get 2 free unlocks

Unlock quizzes for free by uploading documents