Provide an appropriate response.
-The graph below is an ogive of scores on a math test. 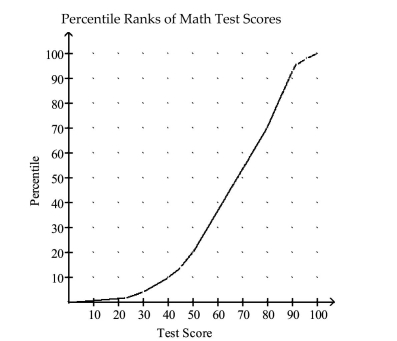 Use the graph to approximate the percentile rank of an individual whose test score is 70.
A) 53
B) 80
C) 58
D) 75
Correct Answer:
Verified
Q136: Provide an appropriate response.
-The weights (in
Q137: Use the grouped data formulas to
Q138: Use the grouped data formulas to
Q139: Use the grouped data formulas to find
Q140: Provide an appropriate response.
-The cholesterol levels
Q142: Provide an appropriate response.
-The midpoints A,
Q143: Provide an appropriate response.
-The cholesterol levels
Q144: Provide an appropriate response.
-Use the data
Q145: Provide an appropriate response.
-The test scores
Q146: Provide an appropriate response.
-For the mathematics part
Unlock this Answer For Free Now!
View this answer and more for free by performing one of the following actions

Scan the QR code to install the App and get 2 free unlocks

Unlock quizzes for free by uploading documents