The figure below shows the predicted distribution of biomes following a 4ᵒ C increase in average global temperature. 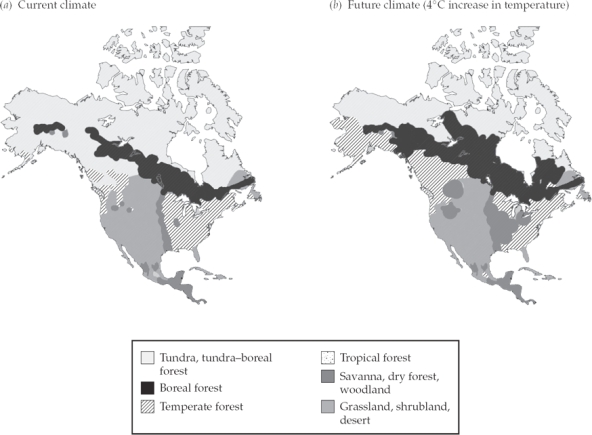
What biome in North America, in addition to deserts, becomes more common and how can the change be explained?
A) Boreal forests expand because warmer temperatures reduce the extent of snow coverage and allow conifers to begin spring growth earlier.
B) Tundra expands because melted permafrost provides new habitat for cold-adapted grasses and herbs.
C) Topical forests expand because warmer temperatures expand tropical habitats, increase evaporation from the ocean surface, and provide the necessary rainfall.
D) Grasslands expand because warmer temperatures decrease average global rainfall, converting forest biomes to grasslands.
Correct Answer:
Verified
Q15: Intentionally supplementing nitrogen into a monoculture like
Q25: The single most significant human-caused contribution (about
Q29: Why is the amount of nitrogen that
Q29: Which of the following cycles appears to
Q30: Biodeisel fuel is produced from oils synthesized
Q31: Global warming is likely to have much
Q33: The graph below illustrates the relationship between
Q36: What is the main reason that humans
Q38: What will happen in the future if
Q39: When plants are initially exposed to elevated
Unlock this Answer For Free Now!
View this answer and more for free by performing one of the following actions

Scan the QR code to install the App and get 2 free unlocks

Unlock quizzes for free by uploading documents