The following graph displays the rate of the production of X as a function of time. 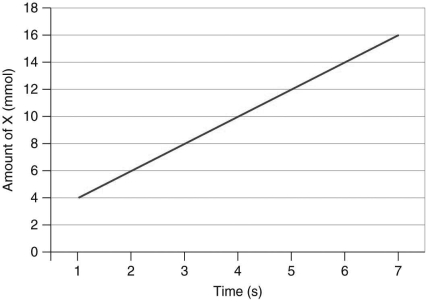
Which equation represents the slope of this line?
A)
B)
C)
D)
Correct Answer:
Verified
Q9: The following equation represents the proportionality of
Q10: The following equation describes variables that are
Q11: Which of the following is true about
Q12: In the phenomenon of proportionality,
A) a variable
Q13: In an equation,the independent variable is which
Q14: A scientist quantifies substance A in a
Q16: The following graph is the standard curve
Q17: The following equation represents two directly proportional
Q18: Consider the following equation: y = 2x
Which
Q19: Consider the following equation: y = 2x
Unlock this Answer For Free Now!
View this answer and more for free by performing one of the following actions

Scan the QR code to install the App and get 2 free unlocks

Unlock quizzes for free by uploading documents