The following graph is the standard curve for absorbance of an analyte. 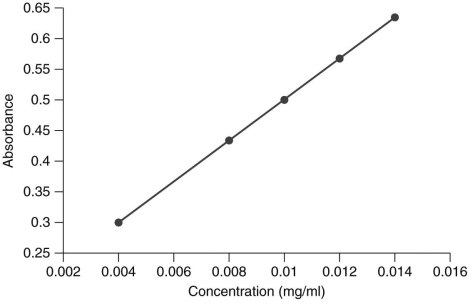
In the laboratory,you are presented with a solution with an unknown concentration of the analyte.You measure the absorbance of the solution and determine it to be 0.75.Can the analyte's concentration in the solution be determined using this standard curve?
A) No, because glucose concentrations cannot exceed 0.016 mg/ml.
B) No, because the concentration must be extrapolated.
C) Yes, because the concentration can be interpolated.
D) Yes, because the standard curve is linear.
Correct Answer:
Verified
Q9: The following equation represents the proportionality of
Q10: The following equation describes variables that are
Q11: Which of the following is true about
Q12: In the phenomenon of proportionality,
A) a variable
Q13: In an equation,the independent variable is which
Q14: A scientist quantifies substance A in a
Q15: The following graph displays the rate
Q17: The following equation represents two directly proportional
Q18: Consider the following equation: y = 2x
Which
Q19: Consider the following equation: y = 2x
Unlock this Answer For Free Now!
View this answer and more for free by performing one of the following actions

Scan the QR code to install the App and get 2 free unlocks

Unlock quizzes for free by uploading documents