For the table below, calculate the percent of students that fell within the B class. 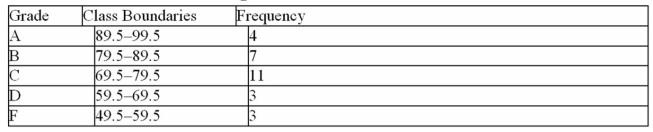
A) 14%
B) 25%
C) 11%
D) 39%
Correct Answer:
Verified
Q4: When data are collected in original form,
Q15: If a frequency distribution had class boundaries
Q30: The three most commonly used graphs in
Q68: Choose the correct statement describing the following
Q70: The following information shows the colours of
Q71: A local fundraiser wants to graphically display
Q72: Q73: The _ is obtained by first adding Q74: Using the following frequency distribution, construct a Q78: ![]()
![]()
Unlock this Answer For Free Now!
View this answer and more for free by performing one of the following actions

Scan the QR code to install the App and get 2 free unlocks

Unlock quizzes for free by uploading documents