Essay
A local fundraiser wants to graphically display the contributions they have
received over the past five years.Construct a time series graph for the following
data. 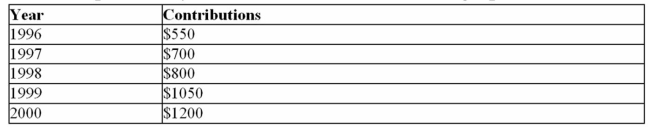
Correct Answer:
Verified
Related Questions
Q4: When data are collected in original form,
Q15: If a frequency distribution had class boundaries
Q66: Q68: Choose the correct statement describing the following Q69: A _ would most appropriately represent the Q70: The following information shows the colours of![]()
Unlock this Answer For Free Now!
View this answer and more for free by performing one of the following actions

Scan the QR code to install the App and get 2 free unlocks

Unlock quizzes for free by uploading documents