Use this graph to answer the question. 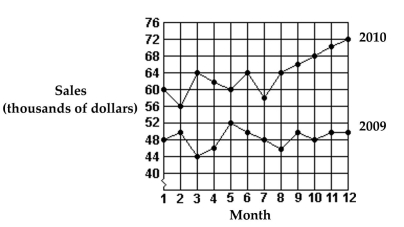
-What was the total increase in sales for the first 6 months from 2009 to 2010?
A) $18,000
B) $76,000
C) $12,000
D) $652,000
Correct Answer:
Verified
Q17: Solve the problem.
-A company that manufactures computer
Q18: Find the median.
-Number of orders: 6, 4,
Q19: Find the median.
-Cost of cellular phones: $100,
Q20: Provide an appropriate response.
-Describe some situations where
Q21: Solve the following circle graph problems.
-If total
Q23: Use this graph to answer the question.
Q24: Describe the distributions with a pie chart.
-The
Q25: Find the mode or modes.
-81, 35, 32,
Q26: Find the weighted mean. Round to the
Q27: This frequency table gives the distribution of
Unlock this Answer For Free Now!
View this answer and more for free by performing one of the following actions

Scan the QR code to install the App and get 2 free unlocks

Unlock quizzes for free by uploading documents