Describe the distributions with a pie chart.
-The following figures give the economic distribution for 5,000 people who live in a certain county. 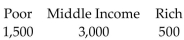
A) 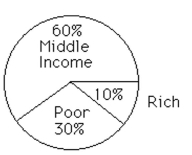
B) 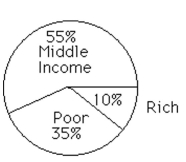
Correct Answer:
Verified
Q19: Find the median.
-Cost of cellular phones: $100,
Q20: Provide an appropriate response.
-Describe some situations where
Q21: Solve the following circle graph problems.
-If total
Q22: Use this graph to answer the question.
Q23: Use this graph to answer the question.
Q25: Find the mode or modes.
-81, 35, 32,
Q26: Find the weighted mean. Round to the
Q27: This frequency table gives the distribution of
Q28: This frequency table gives the distribution of
Q29: Make a line graph using the given
Unlock this Answer For Free Now!
View this answer and more for free by performing one of the following actions

Scan the QR code to install the App and get 2 free unlocks

Unlock quizzes for free by uploading documents