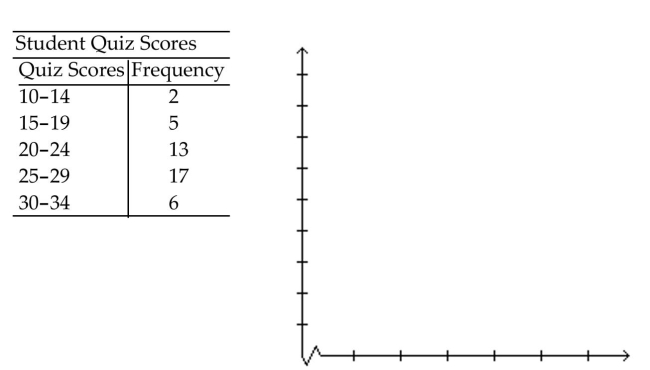
Make a line graph using the given frequencies.
-
A) 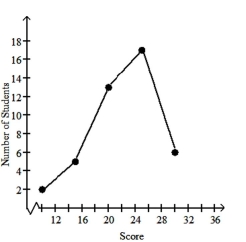
B) 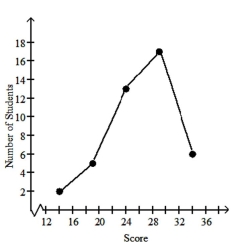
C) 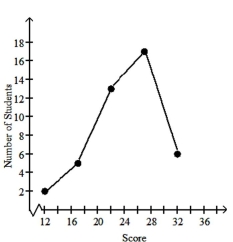
D) None of the above
Correct Answer:
Verified
Q24: Describe the distributions with a pie chart.
-The
Q25: Find the mode or modes.
-81, 35, 32,
Q26: Find the weighted mean. Round to the
Q27: This frequency table gives the distribution of
Q28: This frequency table gives the distribution of
Q30: Find the grade point average for the
Q31: Find the median.
-Salaries of doctors: $115,000, $123,000,
Q32: Find the mean. Round to the nearest
Q33: This frequency table gives the distribution of
Q34: Find the median.
-Monthly net gains: $8,768, $1,824,
Unlock this Answer For Free Now!
View this answer and more for free by performing one of the following actions

Scan the QR code to install the App and get 2 free unlocks

Unlock quizzes for free by uploading documents