Describe the distributions with a pie chart.
-The following data give the color distribution of 1,000 carnations ordered by a local florist. 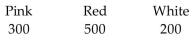
A) 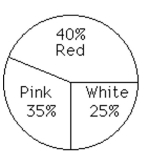
B) 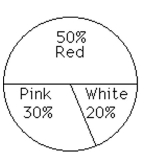
Correct Answer:
Verified
Q43: Solve the problem.
-The batting percentages of some
Q44: Solve the following circle graph problems.
-If total
Q45: Find the mean. Round to the nearest
Q46: Use this graph to answer the question.
Q47: Find the mean. Round to the nearest
Q49: Find the mean. Round to the nearest
Q50: This frequency table gives the distribution of
Q51: This frequency table gives the distribution of
Q52: Solve the problem.
-Customer relations specialists need to
Q53: Make a line graph using the given
Unlock this Answer For Free Now!
View this answer and more for free by performing one of the following actions

Scan the QR code to install the App and get 2 free unlocks

Unlock quizzes for free by uploading documents