Use this graph to answer the question. 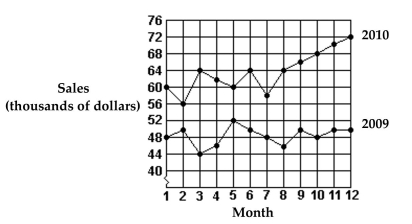
-What were the total sales for 2009?
A) $50,000
B) $582,000
C) $764,000
D) $48,000
Correct Answer:
Verified
Q41: Solve the following circle graph problems.
-If total
Q42: Use this graph to answer the question.
Q43: Solve the problem.
-The batting percentages of some
Q44: Solve the following circle graph problems.
-If total
Q45: Find the mean. Round to the nearest
Q47: Find the mean. Round to the nearest
Q48: Describe the distributions with a pie chart.
-The
Q49: Find the mean. Round to the nearest
Q50: This frequency table gives the distribution of
Q51: This frequency table gives the distribution of
Unlock this Answer For Free Now!
View this answer and more for free by performing one of the following actions

Scan the QR code to install the App and get 2 free unlocks

Unlock quizzes for free by uploading documents