Use this graph to answer the question. 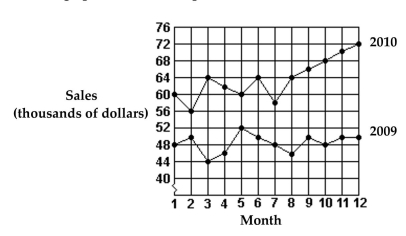
-What were the total sales for the first 6 months of 2010?
A) $64,000
B) $286,000
C) $366,000
D) $302,000
Correct Answer:
Verified
Q37: Use this graph to answer the question.
Q38: Use this graph to answer the question.
Q39: Make a bar graph using the given
Q40: This frequency table gives the distribution of
Q41: Solve the following circle graph problems.
-If total
Q43: Solve the problem.
-The batting percentages of some
Q44: Solve the following circle graph problems.
-If total
Q45: Find the mean. Round to the nearest
Q46: Use this graph to answer the question.
Q47: Find the mean. Round to the nearest
Unlock this Answer For Free Now!
View this answer and more for free by performing one of the following actions

Scan the QR code to install the App and get 2 free unlocks

Unlock quizzes for free by uploading documents