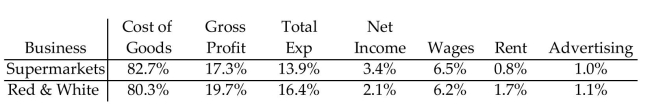
The table compares the national averages for an industry to the results for a given company in the industry. Identify any areas that might require attention by management and offer suggestions.
-
Correct Answer:
Verified
Q1: The table compares the national averages for
Q2: Provide an appropriate response.
-Explain the purpose of
Q4: Provide an appropriate response.
-Explain the purpose of
Q5: Provide an appropriate response.
-Explain why the acid-test
Q6: Complete the comparative income statement. Round percents
Q7: Provide an appropriate response.
-Explain how to determine
Q8: Complete the balance sheet using vertical analysis.
Q9: Find (a) the gross profit, (b) the
Q10: Provide an appropriate response.
-Explain the purpose of
Q11: The following chart shows some figures from
Unlock this Answer For Free Now!
View this answer and more for free by performing one of the following actions

Scan the QR code to install the App and get 2 free unlocks

Unlock quizzes for free by uploading documents