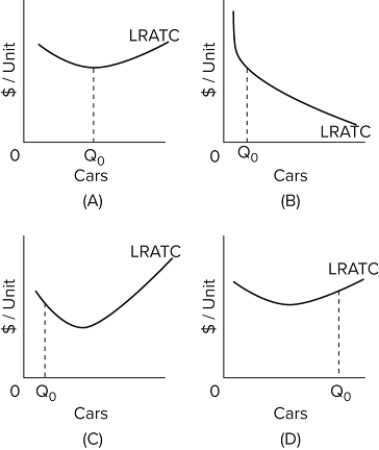
 Refer to the provided graphs. They show the long-run average total cost (LRATC) for cars. Just after World War II, the Ford Motor Company opened a large automobile manufacturing facility near Detroit with capacity Q ₀ autos per year. Shortly thereafter, the plant was closed and two smaller ones were opened in the same vicinity, each more profitably producing about one-half as many cars as the old facility. Which graph best shows the situation just described, when only one plant was operating?
A) graph A
B) graph B
C) graph C
D) graph D
Correct Answer:
Verified
Q382: A firm doubles the quantity of all
Q383: The following schedule gives the cost data
Q384: Plant sizes get larger as you move
Q385: When a firm is experiencing diseconomies of
Q386: When a firm is experiencing economies of
Q388: If the long-run average total cost curve
Unlock this Answer For Free Now!
View this answer and more for free by performing one of the following actions

Scan the QR code to install the App and get 2 free unlocks

Unlock quizzes for free by uploading documents