Multiple Choice
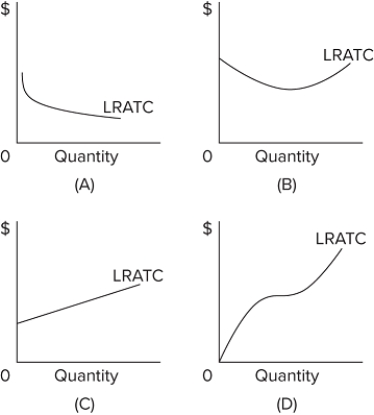 Refer to the provided graphs. They show the long-run average total cost (LRATC) for a product. For which graph would a firm not be experiencing diseconomies of scale?
A) graph A
B) graph B
C) graph C
D) graph D
Correct Answer:
Verified
Related Questions
Q384: Plant sizes get larger as you move
Q385: When a firm is experiencing diseconomies of
Q386: When a firm is experiencing economies of
Unlock this Answer For Free Now!
View this answer and more for free by performing one of the following actions

Scan the QR code to install the App and get 2 free unlocks

Unlock quizzes for free by uploading documents