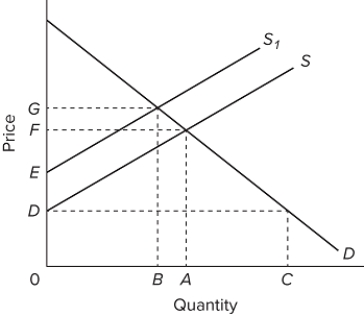
 Refer to the provided supply and demand graph for a product. In the graph, line S is the current supply of this product, while line S1 is the optimal supply from the society's perspective. This figure suggests that there is (are)
A) external benefits from the production of this product.
B) external costs in the production of this product.
C) currently an underallocation of resources toward producing this product.
D) positive externalities from producing the product.
Correct Answer:
Verified
Q162: Q163: It is the custom for paper mills Q164: It is the custom for paper mills Q165: An emission fee levied against polluting firms Q166: Where there are spillover (or external)benefits from Q168: Near an ocean beach, a high-rise building Unlock this Answer For Free Now! View this answer and more for free by performing one of the following actions Scan the QR code to install the App and get 2 free unlocks Unlock quizzes for free by uploading documents![]()

