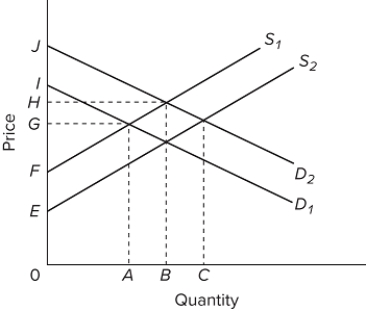
 Refer to the provided supply and demand graph. S₁ and D₁ represent the current market supply and demand, respectively. S₂ and D₂ represent the socially optimal supply and demand. The positions of the graphs indicate that there are
A) external benefits from production and external costs from consumption of the product.
B) external costs from production and external benefits from consumption of the product.
C) external benefits from production and consumption of the product.
D) external costs from production and consumption of the product.
Correct Answer:
Verified
Q110: Which of the following is an example
Q158: Q159: Q160: When there is overproduction of a good, Q161: Q163: It is the custom for paper mills Q164: It is the custom for paper mills Q165: An emission fee levied against polluting firms Q166: Where there are spillover (or external)benefits from Q167: Unlock this Answer For Free Now! View this answer and more for free by performing one of the following actions Scan the QR code to install the App and get 2 free unlocks Unlock quizzes for free by uploading documents![]()
![]()
A)the![]()
![]()

