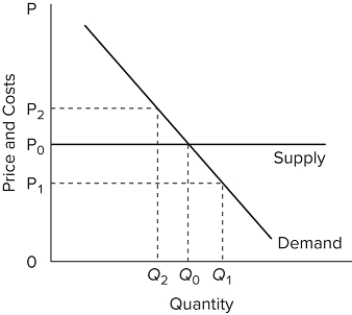
 The accompanying graph shows the long-run supply and demand curves in a purely competitive market. The curves suggest that in this industry, the dollars' worth of other products that have to be sacrificed in order to produce each unit of the output of this industry is
A) constant.
B) increasing.
C) decreasing.
D) not indicated in the graph.
Correct Answer:
Verified
Q191: When a purely competitive firm is in
Q192: In the context of analyzing economic efficiency,
Q193: Q194: Which of the following statements about a Q195: When a purely competitive firm is in Q197: In the context of analyzing economic efficiency, Q198: Which is true of a purely competitive Q199: Resources are efficiently allocated when production occurs Q200: The difference between the maximum price a Q201: ![]()
![]()
Unlock this Answer For Free Now!
View this answer and more for free by performing one of the following actions

Scan the QR code to install the App and get 2 free unlocks

Unlock quizzes for free by uploading documents