Multiple Choice
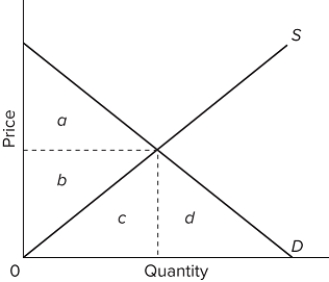 The accompanying graph represents the purely competitive market for a product. When the market is at equilibrium, the producer surplus would be represented by the area
A) b + c.
B) b.
C) c.
D) b + c + d.
Correct Answer:
Verified
Related Questions
Q196: Q197: In the context of analyzing economic efficiency, Q198: Which is true of a purely competitive Q199: Resources are efficiently allocated when production occurs Q200: The difference between the maximum price a![]()
Unlock this Answer For Free Now!
View this answer and more for free by performing one of the following actions

Scan the QR code to install the App and get 2 free unlocks

Unlock quizzes for free by uploading documents