Services
Discover
Question 285
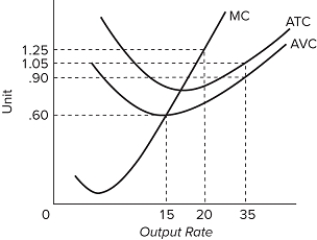
The accompanying graph shows the cost curves for a competitive firm. If the market price falls to $0.55, the optimal output is
A) 0.B) 15.C) 20.D) more than 20, but less than 35.
Correct Answer:
Verified
Unlock this answer nowGet Access to more Verified Answers free of charge
Q280: Q281: Q282: Q283: Q284: Q286: The short-run supply curve for a competitiveQ287: Q288: Q289: Q290: Unlock this Answer For Free Now!View this answer and more for free by performing one of the following actionsScan the QR code to install the App and get 2 free unlocksMaximize QR codeUnlock quizzes for free by uploading documentsUpload documents
Q281: Q282: Q283: Q284: Q286: The short-run supply curve for a competitiveQ287: Q288: Q289: Q290: Unlock this Answer For Free Now!View this answer and more for free by performing one of the following actionsScan the QR code to install the App and get 2 free unlocksMaximize QR codeUnlock quizzes for free by uploading documentsUpload documents
Q282: Q283: Q284: Q286: The short-run supply curve for a competitiveQ287: Q288: Q289: Q290: Unlock this Answer For Free Now!View this answer and more for free by performing one of the following actionsScan the QR code to install the App and get 2 free unlocksMaximize QR codeUnlock quizzes for free by uploading documentsUpload documents
Q283: Q284: Q286: The short-run supply curve for a competitiveQ287: Q288: Q289: Q290: Unlock this Answer For Free Now!View this answer and more for free by performing one of the following actionsScan the QR code to install the App and get 2 free unlocksMaximize QR codeUnlock quizzes for free by uploading documentsUpload documents
Q284: Q286: The short-run supply curve for a competitiveQ287: Q288: Q289: Q290: Unlock this Answer For Free Now!View this answer and more for free by performing one of the following actionsScan the QR code to install the App and get 2 free unlocksMaximize QR codeUnlock quizzes for free by uploading documentsUpload documents
Q286: The short-run supply curve for a competitive
Q287: Q288: Q289: Q290: Unlock this Answer For Free Now!View this answer and more for free by performing one of the following actionsScan the QR code to install the App and get 2 free unlocksMaximize QR codeUnlock quizzes for free by uploading documentsUpload documents
Q288: Q289: Q290: Unlock this Answer For Free Now!View this answer and more for free by performing one of the following actionsScan the QR code to install the App and get 2 free unlocksMaximize QR codeUnlock quizzes for free by uploading documentsUpload documents
Q289: Q290:
Q290:
Unlock this Answer For Free Now!
View this answer and more for free by performing one of the following actions
Scan the QR code to install the App and get 2 free unlocks
Unlock quizzes for free by uploading documents

 The accompanying graph shows the cost curves for a competitive firm. If the market price falls to $0.55, the optimal output is
