Multiple Choice
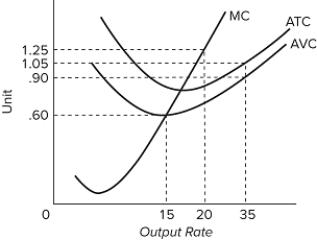 The accompanying graph shows the cost curves for a competitive firm. If the market price of the product is $1.05 per unit, then the firm will produce how many units in the short run?
A) between 0 and 15
B) between 15 and 20
C) between 20 and 35
D) above 35
Correct Answer:
Verified
Related Questions

