FIGURE 8-1
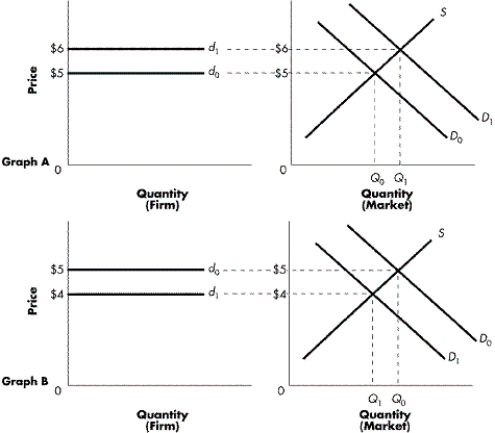
-Refer to Figure 8-1. In Graph A, what is the result of the market demand increasing from D₀ to D₁?
A) The quantity of goods transacted in the market has fallen from Q1 to Q0.
B) Both the market price and the price of the price-taking firm have fallen to $5.
C) Both the market price and the price of the price-taking firm have risen to $6.
D) At the new equilibrium price, the firm will be unable to sell any of its output.
Correct Answer:
Verified
Q30: What will occur if a price-taking firm
Q31: FIGURE 8-2 Q32: Which of the following describes the horizontal Q33: How will a profit-maximizing firm in a Q34: FIGURE 8-1 Q36: What is marginal revenue? Unlock this Answer For Free Now! View this answer and more for free by performing one of the following actions Scan the QR code to install the App and get 2 free unlocks Unlock quizzes for free by uploading documents
![]()
![]()
A) the addition to

