FIGURE 8-2
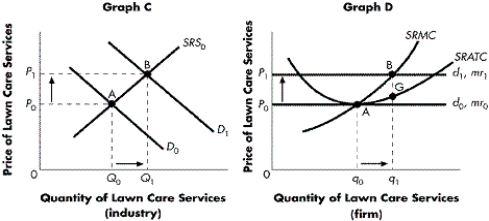
-Refer to Figure 8-2. Using Graph C (a movement from D₀ to D₁) , which of the following statements does NOT describe the diagram?
A) There has been an increase in supply in the market.
B) The equilibrium price in the market has increased from P0 to P1.
C) There has been an increase in demand in the market.
D) There has been a change in quantity supplied from Q0 to Q1.
Correct Answer:
Verified
Q32: Which of the following describes the horizontal
Q33: How will a profit-maximizing firm in a
Q34: FIGURE 8-1 Q35: FIGURE 8-1 Q36: What is marginal revenue? Q38: If a firm produces in the short Q39: In a price taker's market, how does Q40: At what output does a perfectly competitive Q41: TABLE 8-1 Q42: Under what circumstances will a price-taking firm Unlock this Answer For Free Now! View this answer and more for free by performing one of the following actions Scan the QR code to install the App and get 2 free unlocks Unlock quizzes for free by uploading documents
![]()
![]()
A) the addition to
![]()

