The line chart below shows cucumber prices fluctuated from $2.00 per pound to over $4.50 per pound during the year. 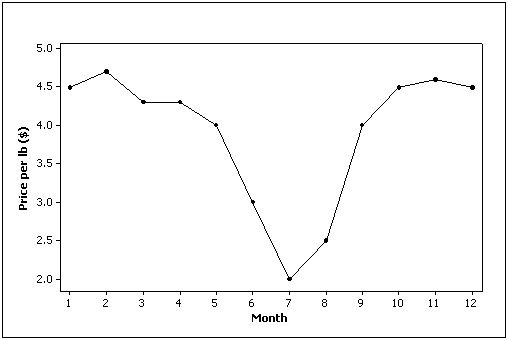
Correct Answer:
Verified
Q8: For what type of data are frequencies
Q13: Which of the following represents a graphical
Q20: Which of the following statements about histograms
Q55: A line chart is created by plotting
Q55: The graph below represents a line graph.
Q56: The first scatter diagram below shows a
Q63: Which of the following describes the shape
Q65: Compare the two histograms below. Which statement
Q84: If two variables have a strong linear
Q100: The two most important characteristics to examine
Unlock this Answer For Free Now!
View this answer and more for free by performing one of the following actions

Scan the QR code to install the App and get 2 free unlocks

Unlock quizzes for free by uploading documents