Exhibit 10-2 Aggregate supply and demand curves 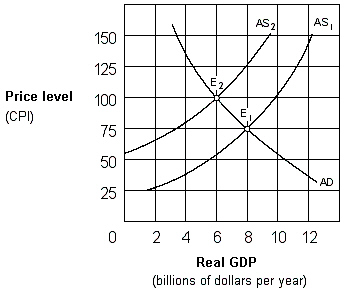 In Exhibit 10-2, the change in equilibrium from E1 to E2 represents:
A) cost-push inflation.
B) demand-pull inflation.
C) price-push inflation.
D) wage-push inflation.
Correct Answer:
Verified
Q82: Lower taxes on businesses will shift the
Q87: Stagflation occurs when the economy experiences:
A) low
Q92: In the United States during the 1960s,
Q110: A decrease in aggregate supply will cause
Q117: Advances in technology will shift the aggregate:
A)
Q123: Stagflation is a period of time when
Q124: A decrease in aggregate supply can result
Q124: Exhibit 10-3 Aggregate supply and demand curves
Q126: Exhibit 10-4 Aggregate supply and demand curves
Q132: An increase in the price level caused
Unlock this Answer For Free Now!
View this answer and more for free by performing one of the following actions

Scan the QR code to install the App and get 2 free unlocks

Unlock quizzes for free by uploading documents