Exhibit 10-4 Aggregate supply and demand curves 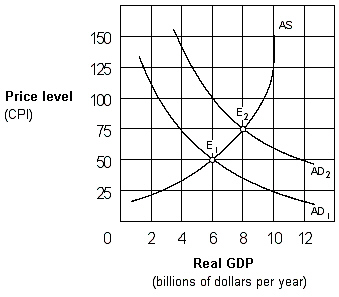 In Exhibit 10-4, point E2 represents:
A) real GDP above full-employment GDP.
B) real GDP that equals full-employment GDP.
C) a depression.
D) real GDP below full-employment GDP.
Correct Answer:
Verified
Q92: In the United States during the 1960s,
Q122: Exhibit 10-2 Aggregate supply and demand curves
Q123: Stagflation is a period of time when
Q124: Exhibit 10-3 Aggregate supply and demand curves
Q124: A decrease in aggregate supply can result
Q128: Exhibit 10-4 Aggregate supply and demand curves
Q129: Exhibit 10-2 Aggregate supply and demand curves
Q130: When OPEC caused the price of oil
Q131: When the aggregate demand curve shifts to
Q132: An increase in the price level caused
Unlock this Answer For Free Now!
View this answer and more for free by performing one of the following actions

Scan the QR code to install the App and get 2 free unlocks

Unlock quizzes for free by uploading documents