Essay
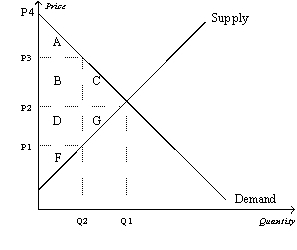
Use the following graph shown to fill in the table that follows.

Correct Answer:
Verified
Related Questions
Q45: The deadweight loss of a tax rises
Q52: The Social Security tax is a labor
Q57: If the size of a tax doubles,
Q60: The Laffer curve is the curve showing
Q101: Using demand and supply diagrams, show the
Q114: Illustrate on three demand-and-supply graphs how the
Q118: John has been in the habit of
Q416: The idea that tax cuts would increase
Q419: Suppose the government levies a tax of
Q457: Suppose that instead of a supply-demand diagram,
Unlock this Answer For Free Now!
View this answer and more for free by performing one of the following actions

Scan the QR code to install the App and get 2 free unlocks

Unlock quizzes for free by uploading documents