Multiple Choice
Figure 10-8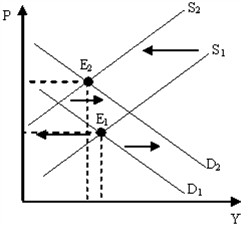
Figure 10-8 describes which of the following periods in the United States?
A) 1930s
B) 1973-1975
C) late 1990s
D) 2007-2009
Correct Answer:
Verified
Related Questions
Q201: What causes the aggregate supply curve to
Q204: The fact that severe fluctuations in inflation
Q206: The case for government stabilization policy is
Q208: Suppose we observe an economy experience an
Q209: Figure 10-9 Q211: Using the concepts of aggregate demand and Q212: From the mid-1980s until late 2007, many![]()
Unlock this Answer For Free Now!
View this answer and more for free by performing one of the following actions

Scan the QR code to install the App and get 2 free unlocks

Unlock quizzes for free by uploading documents