Multiple Choice
Figure 10-9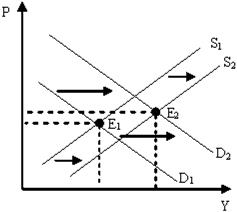
Figure 10-9 illustrates a period of
A) economic growth and high inflation.
B) economic growth and low inflation.
C) economic recession and high inflation.
D) economic recession and low inflation.
Correct Answer:
Verified
Related Questions
Q204: Figure 10-7 Q204: The fact that severe fluctuations in inflation Q205: Figure 10-7 Q206: Figure 10-8 Q208: Figure 10-7 Q208: Suppose we observe an economy experience an Q211: Using the concepts of aggregate demand and Q212: From the mid-1980s until late 2007, many Q213: Figure 10-9 Q214: Figure 10-8 Unlock this Answer For Free Now! View this answer and more for free by performing one of the following actions Scan the QR code to install the App and get 2 free unlocks Unlock quizzes for free by uploading documents![]()
![]()
![]()
![]()
![]()
![]()

