Multiple Choice
Figure 19-2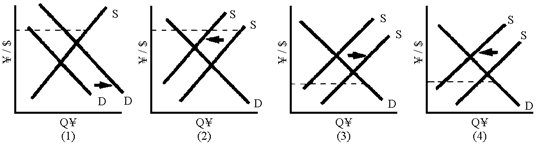
Of the graphs in Figure 19-2, where the broken line represents the fixed exchange rates, which one shows how a balance of payments deficit could be reduced through a recession in Japan?
A) 1
B) 2
C) 3
D) 4
Correct Answer:
Verified
Related Questions
Q161: Why did the Bretton Woods system ultimately
Q164: Figure 19-2 Q167: Speculation in exchange markets is often thought Q169: Adhering to a strict fixed exchange rate![]()

