Multiple Choice
Figure 19-3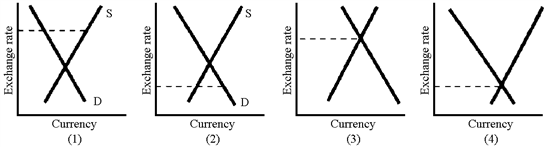
Of the graphs in Figure 19-3, where the dotted line shows the actual exchange rate, which one shows a country with an undervalued currency and a balance of trade surplus?
A) 1
B) 2
C) 3
D) 4
Correct Answer:
Verified
Related Questions
Q161: Why did the Bretton Woods system ultimately
Q167: Speculation in exchange markets is often thought
Q169: Figure 19-2 Q170: Figure 19-2 Q171: In order to "defend" its overvalued currency, Q172: Figure 19-2 Q176: A deficit nation in a fixed exchange Unlock this Answer For Free Now! View this answer and more for free by performing one of the following actions Scan the QR code to install the App and get 2 free unlocks Unlock quizzes for free by uploading documents![]()
![]()
![]()

