Figure 19-3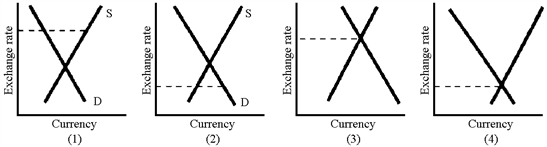
Of the graphs in Figure 19-3, where the dotted line shows the actual exchange rate, which one shows a country with an overvalued currency and a balance of trade deficit?
A) 1
B) 2
C) 3
D) 4
Correct Answer:
Verified
Q161: Why did the Bretton Woods system ultimately
Q167: Speculation in exchange markets is often thought
Q168: Domestic monetary policy is essentially useless under
A)a
Q170: Suppose that a nation has adopted a
Q171: Figure 19-3 Q172: Figure 19-2 Q177: One method for a deficit country to Q178: A country with an undervalued currency Q180: Figure 19-2 Q186: Because central banks intervene in currency markets, Unlock this Answer For Free Now! View this answer and more for free by performing one of the following actions Scan the QR code to install the App and get 2 free unlocks Unlock quizzes for free by uploading documents![]()
![]()
A)will have![]()

