Figure 36 -8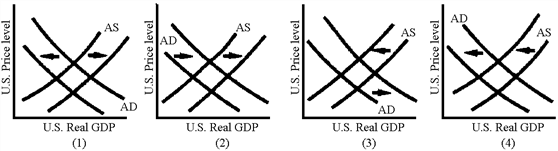
Which of the graphs in Figure 36-8 illustrates the AD-AS shifts associated with an expansionary monetary policy?
A) 1
B) 2
C) 3
D) 4
Correct Answer:
Verified
Q150: Figure 36 -8 Q150: Suppose that the Fed decides to decrease Q151: Figure 36-7 Q153: Why is monetary policy more effective in Q154: Table 36-1 Suppose the economy of Macroland Q156: The international trade response to a contractionary Q157: Suppose that the Fed decides to increase Q158: International capital flows in an open economy Q158: Figure 36-7 Q159: Table 36-1 Suppose the economy of Macroland Unlock this Answer For Free Now! View this answer and more for free by performing one of the following actions Scan the QR code to install the App and get 2 free unlocks Unlock quizzes for free by uploading documents![]()
![]()
![]()

