Figure 36 -8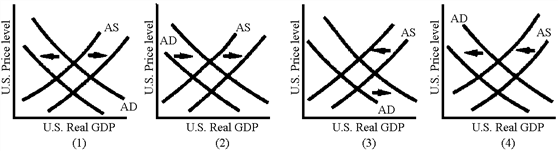
Which of the graphs in Figure 36-8 illustrates the AD-AS shifts induced by the foreign sector following an increase in the U.S. federal deficit?
A) 1
B) 2
C) 3
D) 4
Correct Answer:
Verified
Q144: What does macroeconomic theory predict as the
Q147: In the 1990s, the United States eliminated
Q148: Figure 36-7 Q149: Figure 36 -8 Q149: The different effects of fiscal and monetary Q151: Figure 36-7 Q153: Why is monetary policy more effective in Q154: Table 36-1 Suppose the economy of Macroland Q155: Figure 36 -8 Q157: Suppose that the Fed decides to increase Unlock this Answer For Free Now! View this answer and more for free by performing one of the following actions Scan the QR code to install the App and get 2 free unlocks Unlock quizzes for free by uploading documents![]()
![]()
![]()
![]()

