Multiple Choice
Figure 36 -8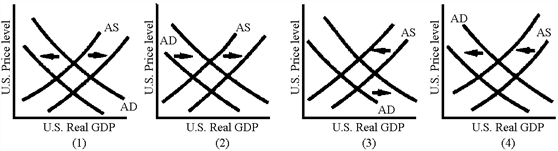
Which of the graphs in Figure 36-8 illustrates the AD-AS shifts associated with a currency depreciation?
A) 1
B) 2
C) 3
D) 4
Correct Answer:
Verified
Related Questions
Q144: What does macroeconomic theory predict as the
Q146: If the United States increased its budget
Q147: In the 1990s, the United States eliminated

