Multiple Choice
Exhibit 1-3 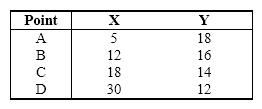 Refer to Exhibit 1-3. According to the data provided in this table, what is the approximate slope of the line between points C and D (if these data were graphed with X on the horizontal axis and Y on the vertical axis) ?
A) -0.17
B) -6.00
C) 0.17
D) 6.00
E) -1.00
Correct Answer:
Verified
Related Questions
Q126: Variables A and B are directly related.
Q127: Many people buy one newspaper per day,
Q128: By looking at the different slices of

