Exhibit 19-5 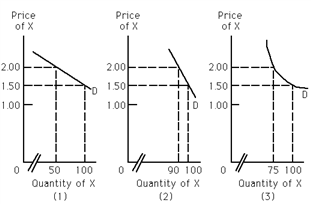
Refer to Exhibit 19-5. Assume that the seller of X increases the price from $1.50 to $2.00, and this results in an increase in total revenue. Which of the graphs could represent the demand curve for X?
A) (1)
B) (2)
C) (3)
D) There is not enough information provided to answer this question.
Correct Answer:
Verified
Q111: If a 7 percent increase in the
Q121: Exhibit 19-5 Q122: Exhibit 19-5 Q123: Exhibit 19-7 Q124: For a straight-line downward-sloping demand curve, price Q126: Exhibit 19-6 Q127: Exhibit 19-5 Q129: Exhibit 19-6 Q130: If tobacco is a normal, income inelastic Q130: Exhibit 19-5 Unlock this Answer For Free Now! View this answer and more for free by performing one of the following actions Scan the QR code to install the App and get 2 free unlocks Unlock quizzes for free by uploading documents![]()
![]()
![]()
![]()
![]()
![]()
![]()

