Multiple Choice
Exhibit 19-5 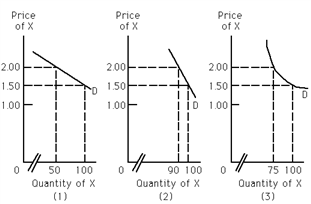
Refer to Exhibit 19-5. Which of the graphs represents a greater percentage change in quantity demanded than the percentage change in price?
A) (1)
B) (2)
C) (3)
D) (2) and (3)
Correct Answer:
Verified
Related Questions
Q111: If a 7 percent increase in the
Q118: The price elasticity of demand indicates
A)buyers' responsiveness
Q119: Cross elasticity of demand measures the responsiveness
Q119: The producer of good X is contemplating

