Multiple Choice
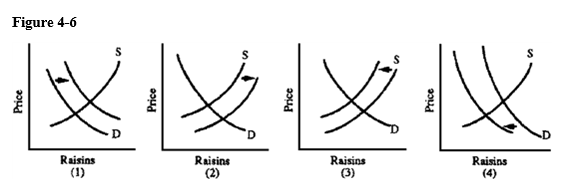 Grapes can be used to produce wine or raisins. Which graph in Figure 4-6 best depicts the effects on the U.S. raisin market of a decline in purchases of domestic wine?
A) 1
B) 2
C) 3
D) 4
Correct Answer:
Verified
Related Questions
Q202: The supply curve of books (which are
Q203: Q203: The quantity of newspapers sold will decline Q204: Suppose we are considering the milk market Q208: The change in the amount of a Q210: The development of new technology reduces the Q212: Professional baseball teams in the United States![]()
Unlock this Answer For Free Now!
View this answer and more for free by performing one of the following actions

Scan the QR code to install the App and get 2 free unlocks

Unlock quizzes for free by uploading documents