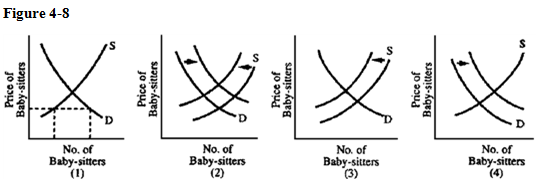
 Families are having more children than families did 15 years earlier. As a result, families have more trouble finding baby-sitters and are shocked at the cost of child care. Which graph in Figure 4-8 best illustrates how the situation has changed?
A) 1
B) 2
C) 3
D) 4
Correct Answer:
Verified
Q203: The quantity of newspapers sold will decline
Q205: The price of one good produced by
Q207: Q210: The development of new technology reduces the Q213: A severe freeze has damaged the Florida Q215: In January, 2,500 quarts of ice cream Q215: Two studies published in the New England Q216: The following price-quantity coordinates for gold used Q218: Pork can be used to produce bacon Q219: Professional baseball teams in the United States![]()
Unlock this Answer For Free Now!
View this answer and more for free by performing one of the following actions

Scan the QR code to install the App and get 2 free unlocks

Unlock quizzes for free by uploading documents