Figure 3-22 
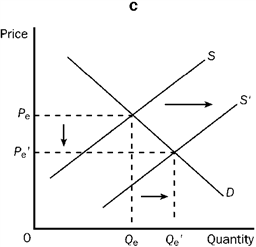
Refer to Figure 3-22. Graph C shows which of the following?
A) An increase in demand and an increase in quantity supplied.
B) An increase in demand and an increase in supply.
C) An increase in quantity demanded and an increase in quantity supplied.
D) An increase in supply and an increase in quantity demanded.
Correct Answer:
Verified
Q350: Figure 3-22 Q351: Which of the following would most likely Q352: Figure 3-22 Q353: Figure 3-23 Q354: Figure 3-23 Q356: If the price of tickets to the Q357: Which of the following would cause the Unlock this Answer For Free Now! View this answer and more for free by performing one of the following actions Scan the QR code to install the App and get 2 free unlocks Unlock quizzes for free by uploading documents![]()
![]()
![]()
![]()

