Multiple Choice
Figure 3-23 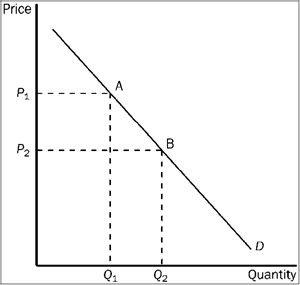
Refer to Figure 3-23. The movement from point A to point B on the graph shows
A) a decrease in demand.
B) an increase in demand.
C) a decrease in quantity demanded.
D) an increase in quantity demanded.
Correct Answer:
Verified
Related Questions
Q348: If cigars and cigarettes are substitute goods,
Q349: Figure 3-22 Q350: Figure 3-22 Q351: Which of the following would most likely Q352: Figure 3-22 Q354: Figure 3-23 Q355: Figure 3-22 Q356: If the price of tickets to the Q357: Which of the following would cause the Q358: Figure 3-22 Unlock this Answer For Free Now! View this answer and more for free by performing one of the following actions Scan the QR code to install the App and get 2 free unlocks Unlock quizzes for free by uploading documents![]()
![]()
![]()
![]()
![]()
![]()

