The graph below depicts the cost structure for a firm in a competitive market.
Figure 9-13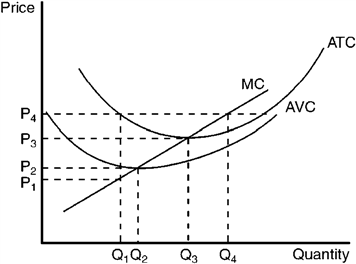
Refer to Figure 9-13. When price rises from P2 to P3, the firm finds that
A) marginal cost exceeds marginal revenue at a production level of Q2.
B) if it produces at output level Q3 it will earn a positive profit.
C) expanding output to Q4 would leave the firm with losses.
D) it could increase profits by lowering output from Q3 to Q2.
Correct Answer:
Verified
Q185: Figure 9-16 Q186: Figure 9-15 Q187: Use the figure to answer the following Q188: Use the figure to answer the following Q189: Use the figure to answer the following Q191: Use the figure to answer the following Q192: Use the figure to answer the following Q193: Use the figure to answer the following Q194: The graph below depicts the cost structure Q195: Figure 9-14 Unlock this Answer For Free Now! View this answer and more for free by performing one of the following actions Scan the QR code to install the App and get 2 free unlocks Unlock quizzes for free by uploading documents![]()
![]()
![]()

