The graph below depicts the cost structure for a firm in a competitive market.
Figure 9-13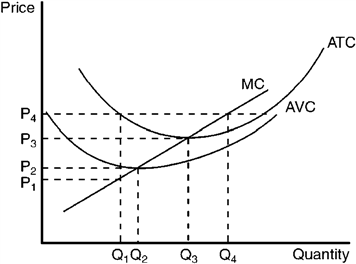
Refer to Figure 9-13. When price falls from P3 to P1, the firm finds that
A) fixed cost is higher at a production level of Q1 than it is at Q3.
B) it should produce Q1 units of output.
C) it should produce Q3 units of output.
D) it should shut down immediately.
Correct Answer:
Verified
Q189: Use the figure to answer the following
Q190: The graph below depicts the cost structure
Q191: Use the figure to answer the following
Q192: Use the figure to answer the following
Q193: Use the figure to answer the following
Q195: Figure 9-14 Q196: The graph below depicts the cost structure Q197: Use the figure to answer the following Q198: Use the figure to answer the following Q199: Figure 9-12 ![]()
![]()
Unlock this Answer For Free Now!
View this answer and more for free by performing one of the following actions

Scan the QR code to install the App and get 2 free unlocks

Unlock quizzes for free by uploading documents