The graph below depicts the cost structure for a firm in a competitive market.
Figure 9-13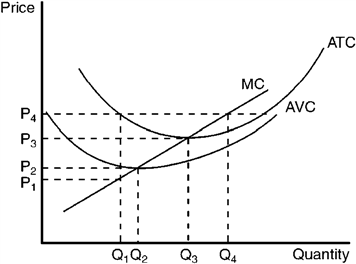
Refer to Figure 9-13. When price rises from P3 to P4, the firm finds that
A) fixed costs are lower at a production level of Q4.
B) it can earn a positive profit by increasing production to Q4.
C) profit is still maximized at a production level of Q3.
D) average revenue exceeds marginal revenue at a production level of Q4.
Correct Answer:
Verified
Q191: Use the figure to answer the following
Q192: Use the figure to answer the following
Q193: Use the figure to answer the following
Q194: The graph below depicts the cost structure
Q195: Figure 9-14 Q197: Use the figure to answer the following Q198: Use the figure to answer the following Unlock this Answer For Free Now! View this answer and more for free by performing one of the following actions Scan the QR code to install the App and get 2 free unlocks Unlock quizzes for free by uploading documents![]()

