Multiple Choice
Figure 9-10 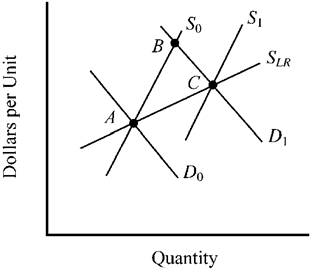
In Figure 9-10, the movement from points A to B to C can best be explained by which of the following factors?
A) a decrease in demand, followed by the entry of new firms and an expansion in supply in a constant cost industry.
B) an increase in demand, followed by the entry of new firms and an expansion in supply in an increasing cost industry.
C) a decrease in demand, followed by the exit of firms and a decline in supply in an increasing cost industry.
D) an increase in demand, followed by the exit of firms and a decline in supply in a constant cost industry.
Correct Answer:
Verified
Related Questions
Q204: In a price-taker market,
A) all firms in
Q217: A firm that must sell its output

